Custom business dashboards
Custom Business Dashboards & Reporting Software
Bring your business data together in custom dashboards that make performance, operations and key metrics easier to understand.
We develop tailored analytics and reporting applications that connect your systems, visualize the information that matters and give teams a clearer view of their work.
The challenge
Business data isn't useful when it's scattered across tools.
Important information often lives in separate sales, operations, finance and marketing systems. Without a connected reporting approach, understanding performance can require repetitive manual work.
-
Disconnected data sources
Teams may rely on multiple applications that report different parts of the business without providing one consistent view.
-
Manual reporting processes
Preparing recurring reports through spreadsheets, exports and copy-pasted figures can consume time and introduce errors.
-
Unclear performance metrics
Different teams may use inconsistent definitions for key figures, making reports difficult to compare or interpret.
-
Limited operational visibility
Without relevant reporting views, identifying changes, exceptions and emerging issues can be unnecessarily difficult.
Dashboard capabilities
Reporting built around the metrics that matter.
Every business measures performance differently. We develop dashboards, data connections and reporting tools around your KPIs, teams and existing systems.
-
Executive & KPI Dashboards
Bring selected performance indicators into clear reporting views tailored to executives, managers and operational teams.
- Business KPIs
- Executive reporting
- Performance summaries
-
Sales & Revenue Analytics
Build reports around sales activity, orders, revenue, customer segments and other available commercial data.
- Sales reporting
- Revenue trends
- Segment comparisons
-
Operational Dashboards
Visualize relevant information from internal processes, inventory, fulfillment, service operations and other connected systems.
- Operational KPIs
- Activity monitoring
- Exception visibility
-
Interactive Reporting & Exploration
Develop dashboards with suitable date ranges, filters, comparisons and drill-down views to help users explore the underlying information.
- Date and category filters
- Comparative views
- Drill-down reports
-
Data Integration & Transformation
Connect compatible data sources and prepare information for reporting through appropriate extraction, transformation and synchronization workflows.
- API and database connections
- Data normalization
- Scheduled or event-driven updates
-
Role-Based Reporting & Distribution
Provide relevant reporting views to authorized users and support suitable scheduled reports or exports where required.
- User permissions
- Scheduled reports
- Exports and sharing controls
From data to decisions
Turn connected business data into useful reporting.
A reporting system combines relevant data, applies agreed definitions and presents information through dashboards designed around the people using them.
-
Connect sources
Identify and connect compatible business applications, databases, files or APIs containing the required data.
-
Collect information
Retrieve relevant records through suitable scheduled, event-driven or other supported data-access methods.
-
Prepare & validate
Normalize data, apply agreed transformations and check for important inconsistencies or missing information.
Data quality check
- Valid: continue processing
- Missing or inconsistent: flag for review
-
Define metrics
Calculate KPIs according to documented business definitions, time periods and aggregation rules.
-
Visualize performance
Present relevant metrics through dashboards, charts, tables and reporting views.
-
Review & explore
Authorized users examine trends, apply supported filters and investigate underlying information when needed.
Reporting accuracy and freshness depend on source-data quality, metric definitions, integration methods and update schedules.
Engineering trustworthy reporting
A useful dashboard starts with dependable data.
Clear charts are only part of the solution. Reporting systems also need consistent definitions, appropriate access controls, reliable integrations and an understanding of when source data was updated.
-
Consistent KPI definitions
Metrics need documented calculation rules, aggregation methods and time boundaries so different views remain comparable.
-
Data quality & traceability
Missing records, duplicate events and transformation errors should be detectable, with suitable ways to trace reported values to their sources.
-
Data freshness & synchronization
Reports should reflect defined update schedules and account for delays or differences between connected systems.
-
Security & access controls
Sensitive business information requires appropriate authentication, authorization and restrictions on reporting, exports and shared views.
How we can help
Build the reporting experience your business needs.
-
Develop a custom dashboard application
Create a tailored reporting interface with the KPIs, data views, user roles and workflows your organization requires.
-
Connect existing business systems
Build integrations and reporting pipelines that combine information from compatible applications and data sources.
-
Improve existing reporting
Modernize spreadsheets, internal reports or dashboard applications with clearer workflows, more useful visualizations and better data connections.
The right approach depends on existing data sources, reporting requirements, update expectations and access needs.
Relevant experience
Experience building software around business data.
Our work includes custom software and connected business systems relevant to building reporting interfaces and operational tools.
-
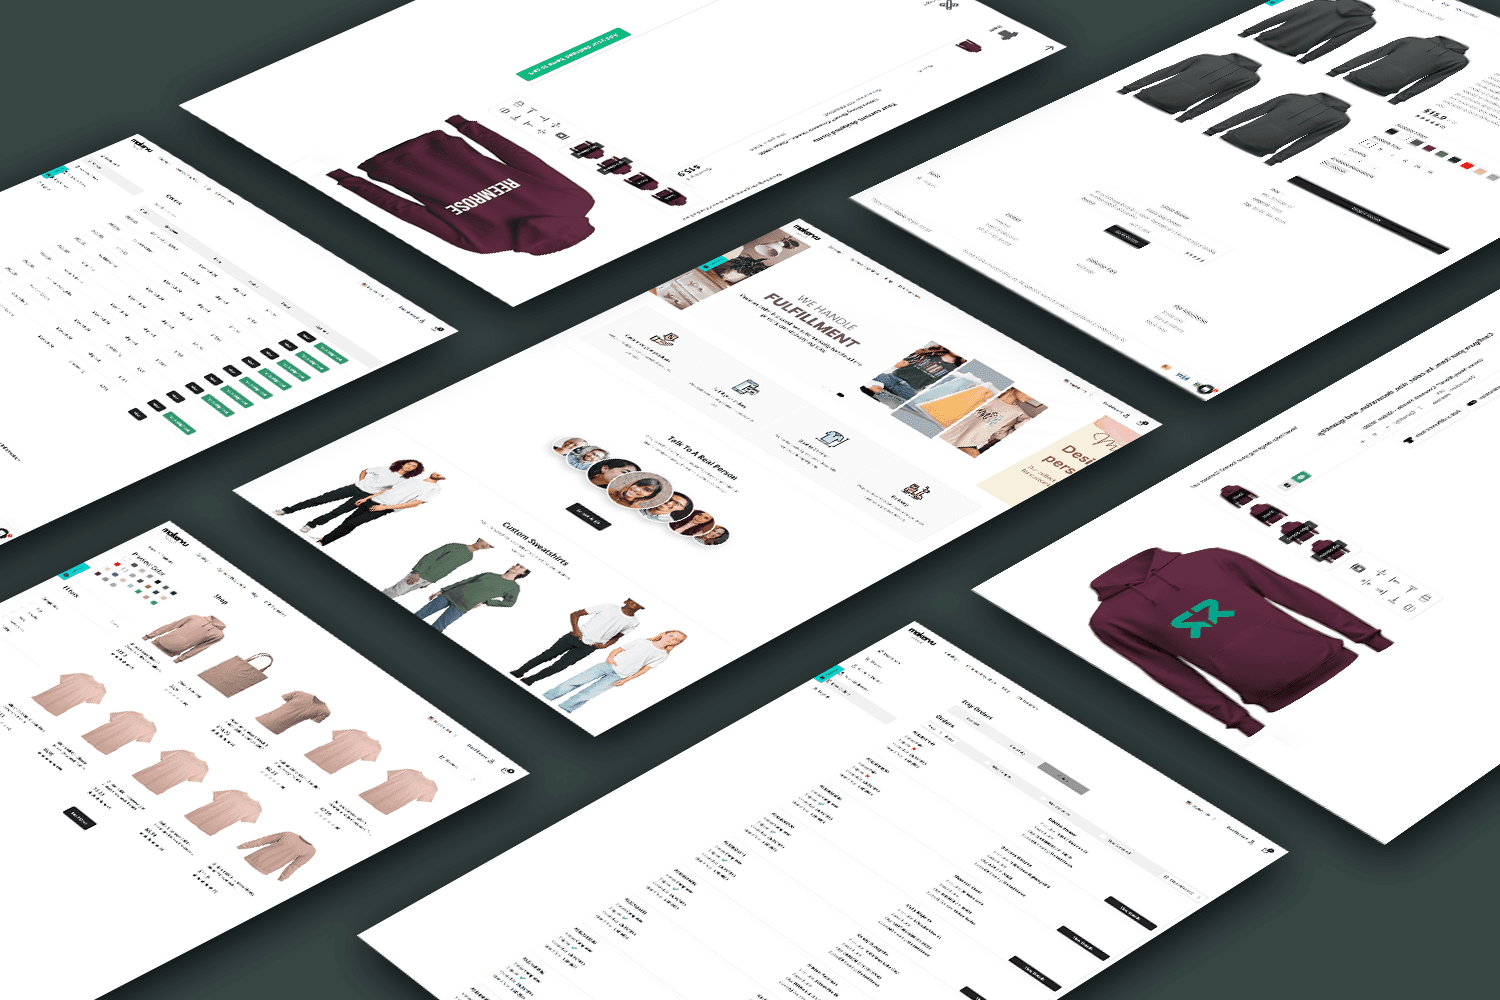
MakerVu
An operational platform for managing orders and internal workflows, reducing the need to coordinate everything through disconnected tools.
Related
The engineering behind your reporting systems.
Explore related solutions.
Frequently asked questions
Can you build a custom dashboard for our business?
Yes. We develop custom business dashboards and reporting applications around the KPIs, data sources, user roles and workflows your organization requires.
Can a dashboard combine data from different systems?
Yes, where compatible access methods exist. We can evaluate connections to business applications, databases and APIs, then define how information should be collected, transformed and presented.
Can dashboards show real-time data?
Real-time or near-real-time updates may be possible depending on the source systems, integration methods and technical requirements. Some reporting workflows are better suited to scheduled updates.
Can different departments have different dashboards?
Yes. We can design role-based reporting views with relevant metrics, permissions and access restrictions for different teams or authorized users.
Can you replace our spreadsheet-based reporting?
We can assess existing spreadsheets and reporting processes to determine which data collection, calculations and visualizations can be moved into a custom application or connected reporting workflow.
How much does custom dashboard development cost?
Cost depends on the number of data sources, reporting complexity, integrations, user permissions, visualizations and refresh requirements. We define the scope before preparing a project-specific proposal.
Let's connect your business data
Need a clearer view of your business performance?
Tell us which metrics matter, where your data lives and who needs access to it. We'll help you explore the right dashboard and reporting approach.